Usage
SED-Fitting
The Dusty-Evolved-Star-Kit can fit the spectra and photometry of evolved stars with both carbon- and oxygen-rich grids of radiative transfer models. This enables easy comparison of grids of models and different samples.
The input for this package is a csv file with wavelength in microns in the first column, and flux in Jy in the second column.
After installation with pip, in any command line prompt, use the command:
> desk grids
This will display the available grids for fitting. Next you need to point the package to your csv file, and specify the distance (in kpc) and grid of choice:
> desk fit --source='target_name.csv' --distance_in_kpc=50 --grid='H11-LMC'
or specify a directory with multiple csv files:
> desk fit --source='folder_of_csvs' --distance_in_kpc=30 --grid='silicates'
Additional fitting options
Users can also specify any-and-all of the following additional options. Requests for more additional features can be submitted through the Issues tab on the Github page.
Grid density
> desk fit --source='target_name.csv' --n=200
The strength of the 1D DUSTY models is that they can be scaled to create more luminous models. The DESK takes the initial grid and scales it n times (default: 50) to create a larger denser grid of sources within the luinosity limits (default: 1,000 - 150,000 Msun). As the shape of the model is the same for each scaling of the grid, the distance to the source(s) is important for an accurate results. A more realistic Bayesian method of fitting is under development.
Wavelength range
> desk fit --source='target_name.csv' --min_wavelength=0.1 --max_wavelength=30
The user may also specify a wavelength minimum and maximum. This will still show the full photometry in the final SED figure, but fit only the wavelength range specified.
Multiprocessing
The user can specify whether to fit using multiprocessing (using all but 1 computer cores), single core fitting (multiprocessing=False), or specify the number of cores to use (multiprocessing=6). Multiprocessing uses a core per source, and will have little affect on small samples or individual sources:
> desk fit --source='target_name.csv' --multiprocessing=True
Output Figures and Model Spectra
For the DUSTY grids, the code automatically outputs the best-fit model spectrum as a csv file named as the target name, grid name, luminosity, effective temperature, inner dust temperature, optical depth, and distance, all separated by underscores. You also have the option of creating a figure with the data and best-fit SED using the following commands.
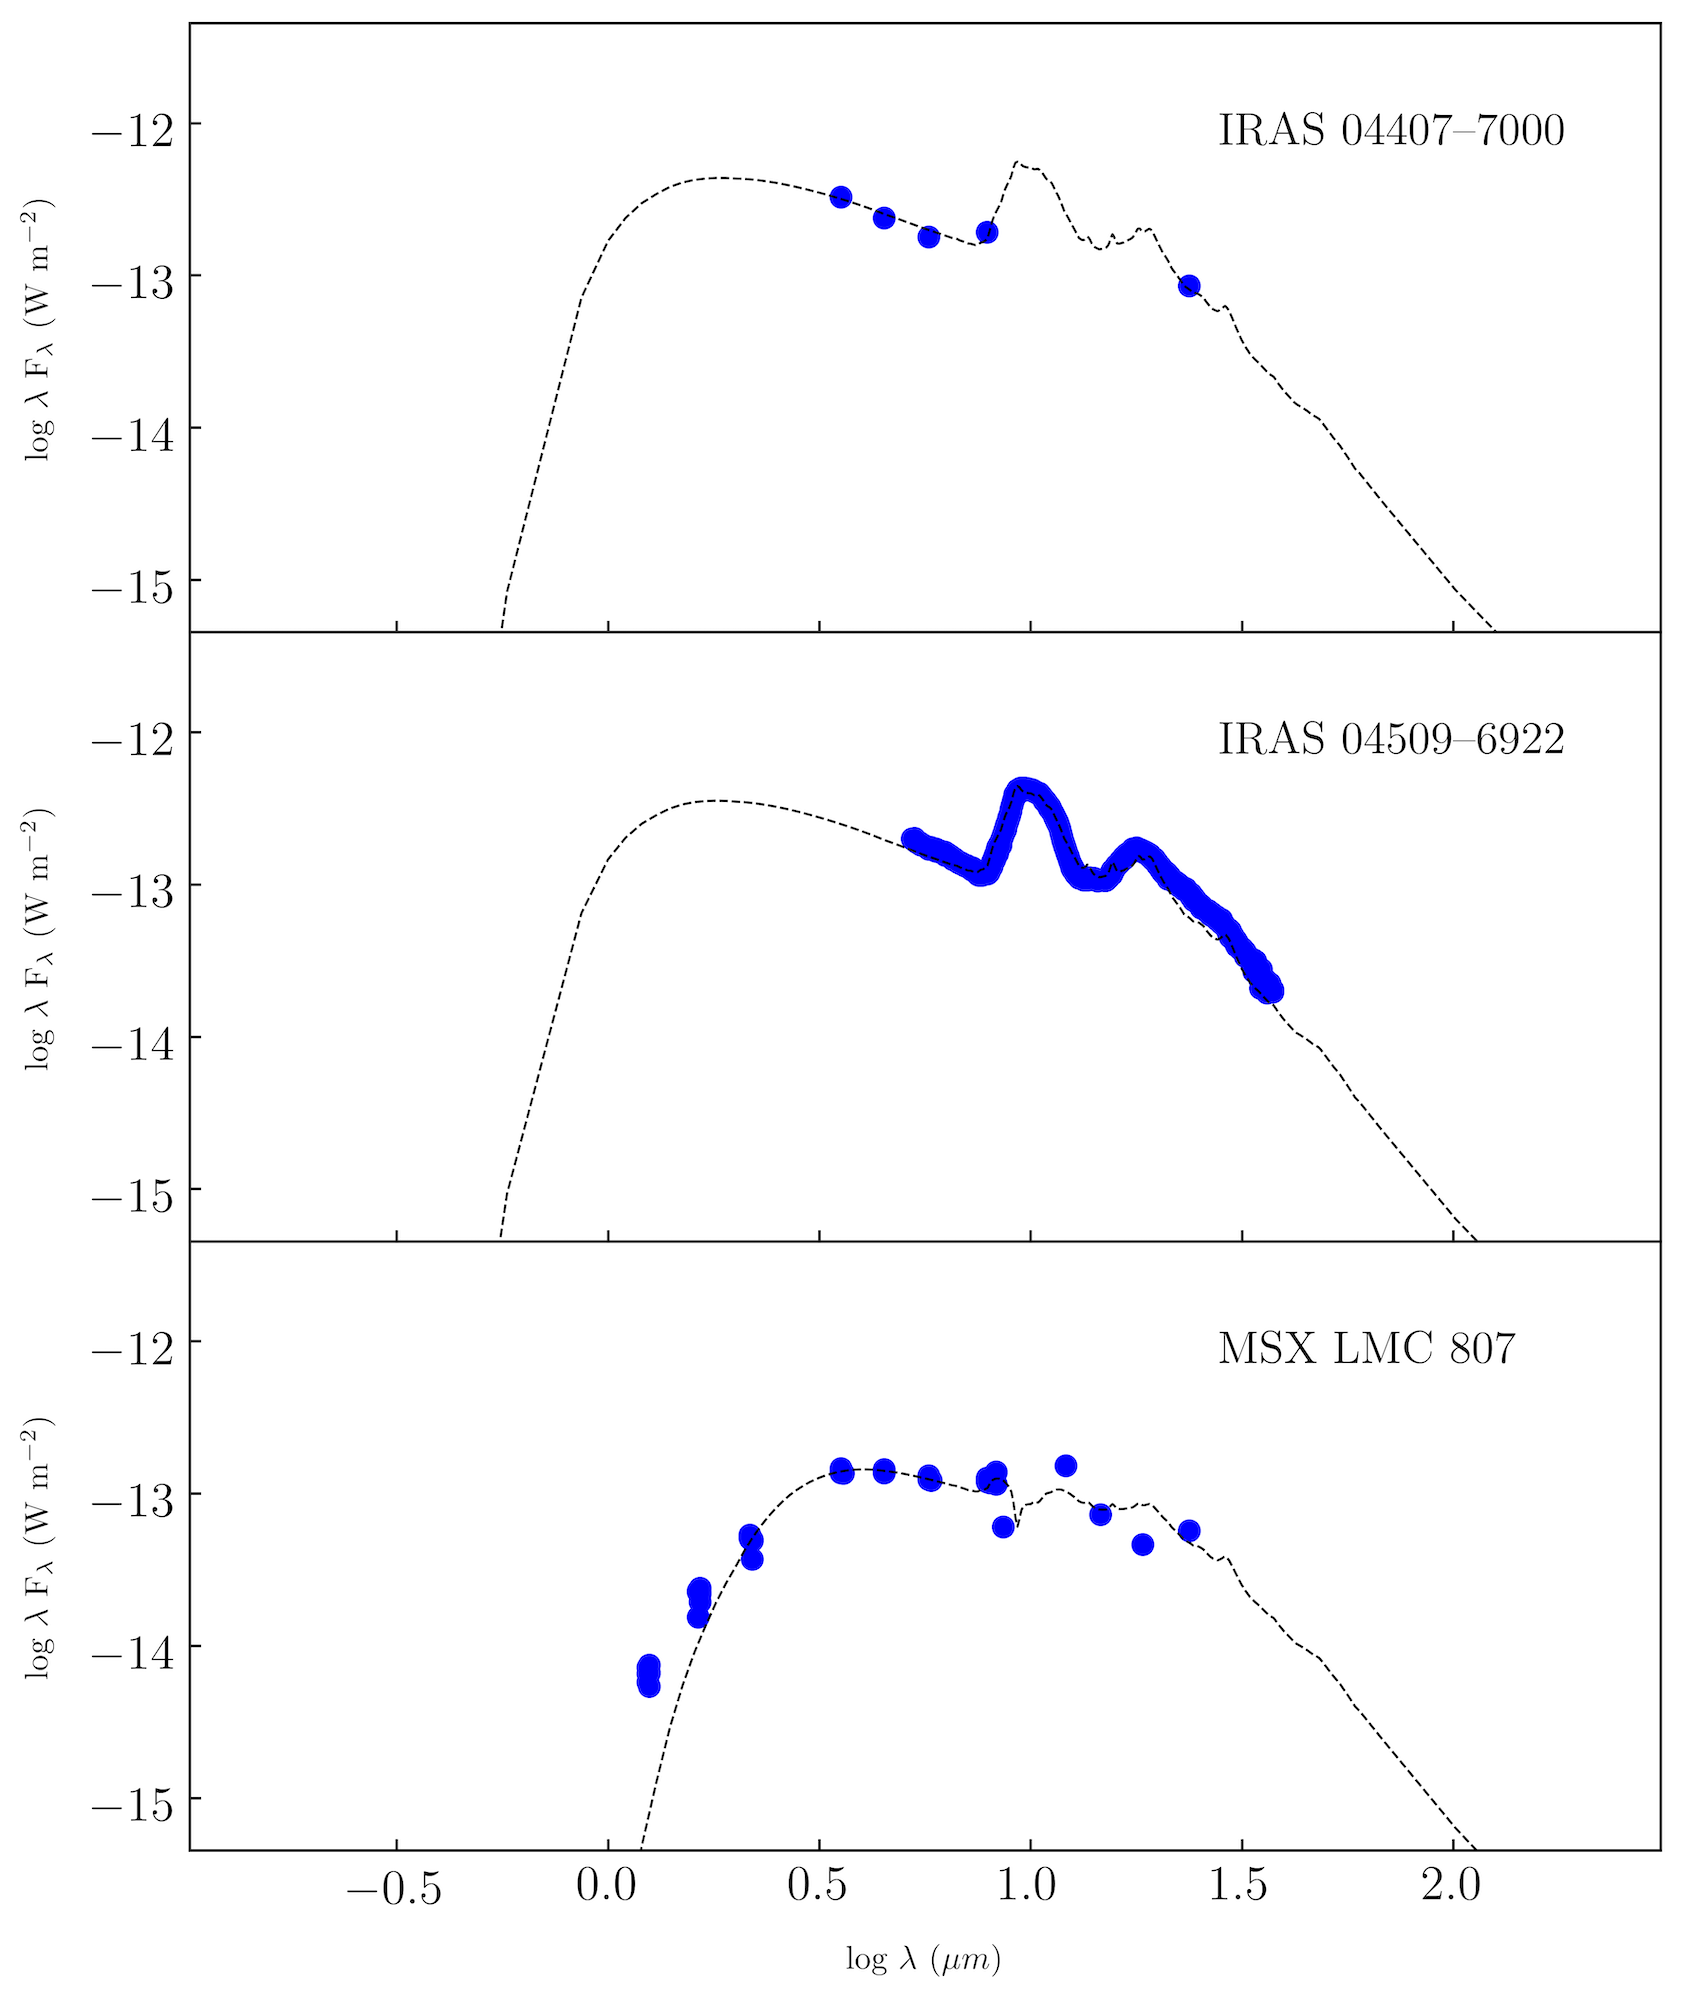
This is an example of the output_sed.png file fitting three massive oxygen-rich AGB stars from the LMC created using
> desk sed
To produce individual figures subsequently run the command:
> desk sed_indiv
Additionally you can specify whether you want the output flux in the figure to be in W/m2 or Jy (W/m2 is the default).
> desk sed --flux='Jy'
Retrieve photometry
Users can retrieve all of the photometry hosted on Vizier for a given source name or coordinates. Retrieving photometry using a source name is as simple as:
> desk vizier_sed 'MSX LMC 807'
In order to return photometry using a source position (RA and Decl. in degrees), use the command:
> desk vizier_sed '(83.15482600, -67.11567600)'
Additionally, you can specify the radius (in arcseconds) you would like to search for photometry using. To specify a 5 arcsecond radius use:
> desk vizier_sed 'MSX LMC 807' --r=5
or
> desk vizier_sed '(083.15482600, -67.11567600)' --r=5
Use in Python Environment
SED-fitting can be done with the DESK within the python environment. To do this simply import the package and use the ‘fit’ function in a similar manner as the console commands.
>>> from desk import *
>>> fit(source="target.csv", distance_in_kpc=3, grid="oxygen")
One can also use the sed, vizier_sed, and grids in a similar fashion.
>>> sed()
>>> sed(flux='Jy')
>>> grids()
>>> vizier_sed('MSX LMC 807', 5)
How reliable in SED-fitting?
The DESK is a tool designed to allow for the easy comparison of samples and model grids. Taken at face value, the results for a given sample or model grid may give incorrect results. For example, recent work by Wiegert et al. 2019 has shown that the assumed geometry can affect measured mass loss rates by several orders of magnitude. It is up to the user to interpret the results, and I would urge those interested in using the DESK to also take a look at the excellent recent review by Leen Decin.
Using Multi-epoch data
The continuum shape of an SED is very useful in constraining values like luminosity and mass-loss rate. For variable evolved stars, however, fluxes can change by orders of magnitude on scales of 200-2000 days. Data taken at different times can alter the observed shape dramtically, and thus using multi-epoch data is discouraged. If a user has a large sample with data in many overlapping bands, the DESK can attempt to fit the median SEDs giving an idea of the properties of the sample as a whole.
Package Testing
The desk uses continuous integration testing through Github actions. This automatically runs the package tests for several commonly used operating systems and python versions, before every change that is made to the code. The current status of the tests and coverage. are available online. To run the tests locally, download/clone the package and use the command ‘pytest’ within the pacakge directory.